
Opening: Why is the “progress board” on the workshop wall always two days ahead of the system?
Walking into a machining factory, you’ll see a whiteboard hanging on the conference room wall, covered with colorful sticky notes, each labeled with a work order number, the current operation, and the machine tool number. Every evening, the shift manager replaces all the notes. The next morning, the boss comes to the workshop and asks, “Has that batch of work been completed?” The workshop director pulls out the board and squints as he counts the notes.
In the same factory, there are often two versions of “progress”: one is the whiteboard with sticky notes, and the other is the work order status in ERP or MES. The former reflects the real situation on the shop floor, while the latter provides figures for finance and customers. It’s normal for these two to be out of sync; when they match, it’s news.
This isn’t unique to any single factory. In workshops we’ve visited—ranging from small workshops with a dozen employees to large complete‑machine factories with thousands—we’ve encountered similar issues:
- Production plans don’t reach the workstations: The planner schedules 30 work orders in the system, but the workshop only sees 8; the rest “remain listed in the system.”
- Progress depends on asking: Dispatchers make dozens of phone calls a day to ask, “Where is this job now?” Even foremen can’t keep track of how far each process has progressed.
- Man-hours don’t match reality: Workers report their time every four hours, but often submit a lump sum just before quitting time, resulting in discrepancies of 20% to 40% between reported and actual cycle times.
- No one monitors abnormalities: A certain process waits three days without materials, yet no one notices; it’s only when the customer presses for delivery that they realize a part is missing.
The problem isn’t that some software isn’t being used—it’s that the link between the “shop floor” and the “system” has broken down. The whiteboard on the wall is more accurate than ERP because it sits right beside the machine tools, maintained by people who directly observe the shop floor; whereas ERP often involves three layers of re-entry—foreman to team leader to dispatcher—each adding delays or errors.
Next, let’s break down how this system should be designed and implemented so that the whiteboard on the wall gradually becomes unnecessary.
01 How to decompose business processes: Break “progress” down into the smallest collectable actions
Many projects start by treating “process progress” as a single field. In fact, “process progress” is a composite state:Which workstation the work order is at,Who is currently working on it,How much has already been done,How many man-hours have been used,Whether the quality meets standards,Whether all materials are available. Each of these six dimensions must be collected separately—not combined into one.
Specifically, here’s how it breaks down:
- Workstation: Each machine tool or workstation has a unique identifier; scanning a QR code or swiping a card pinpoints “whose job this machine is currently doing.”
- Operator: Every work order’s initial operation, transfer step, and completion record is linked to an individual worker ID. Even when master and apprentice collaborate, the lead operator remains the sole recorder.
- Quantity completed: Processes include first inspection, in-process checks, and final counting. Quantity isn’t a status—it must be updated by pressing a button or scanning a code.
- Actual man-hours: The time difference between starting and finishing an operation (automatically recorded), plus any pauses along the way (manually logged if there’s an abnormal stoppage).
- Quality status: Three records—first inspection, in-process check, and final inspection—each independently tracked for pass/fail, rework, or scrap; filling in only a pass rate is not allowed.
- Material completeness: Each material item on the BOM is categorized as “complete,” “incomplete,” or “missing—awaiting replenishment”—and linked to the work order status.
Break all six dimensions into independent “event streams,” rather than grouping them into a single status field. Events are like a running log: who, when, on which machine, how far along, and what abnormalities occurred—all recorded. Status is merely a view derived from these event streams;status fields must not be filled in manually.
02 How to design: Clearly define roles, workflows, data, and interface boundaries
The most common pitfall during the design phase is “building an app for people to fill out,” only to find that after two years of operation, the app contains nothing but a login page and a blank password field. The root cause lies in misaligned roles and interfaces.
Role design
There are four types of people in the workshop, and each uses a different interface:
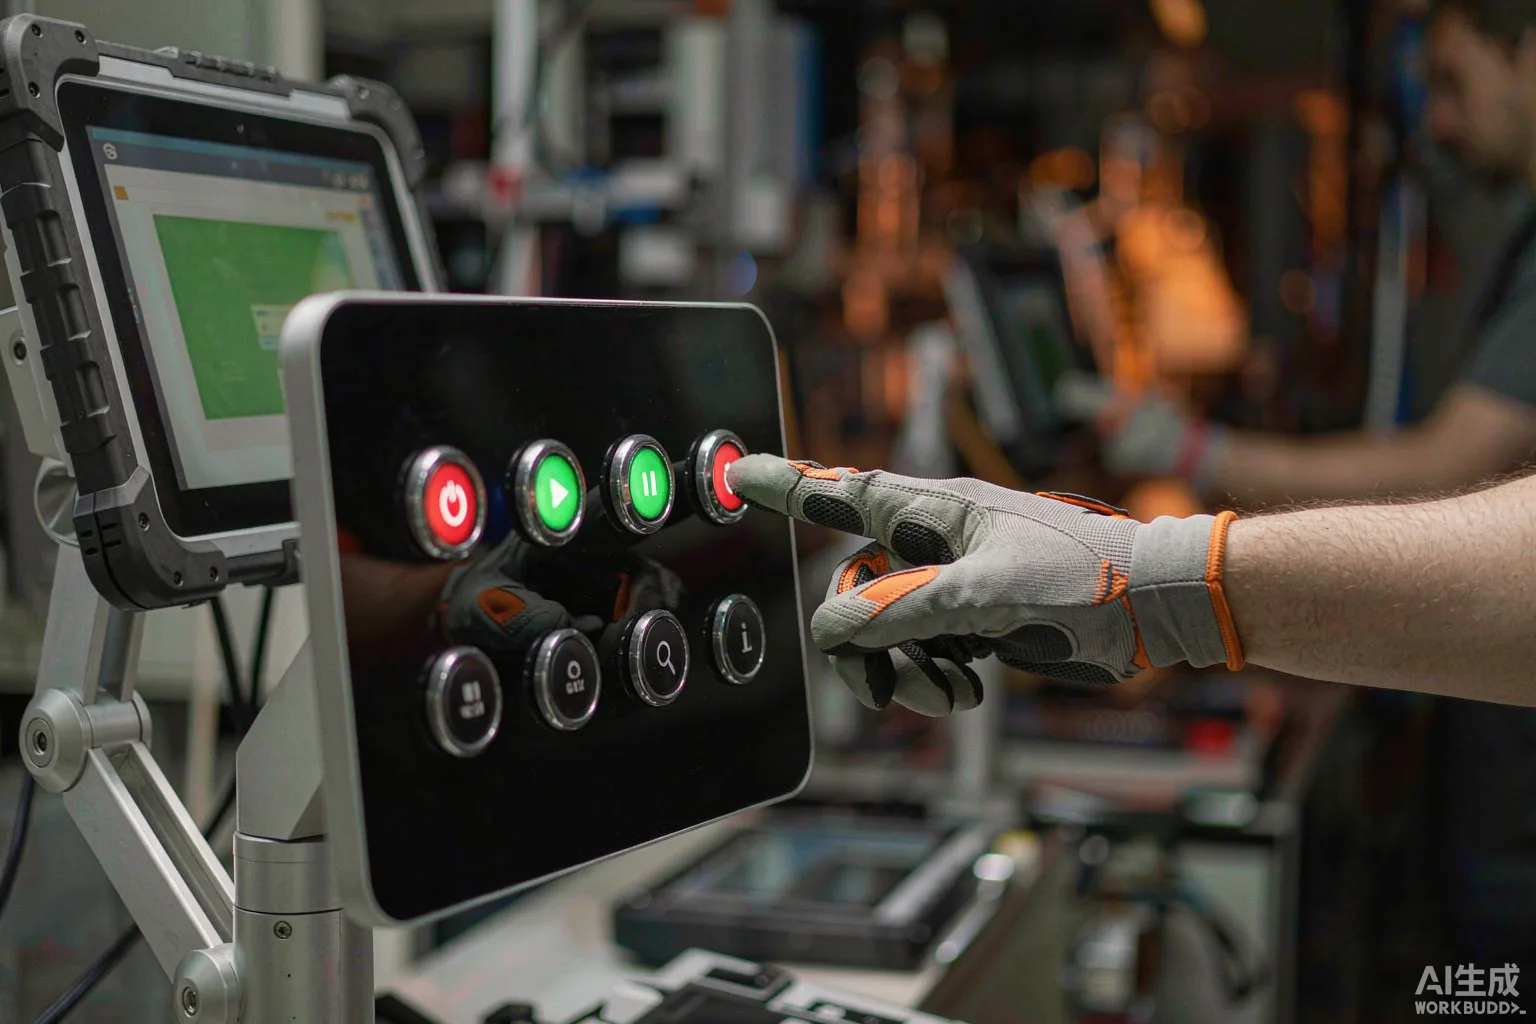
- Operators: Use a workstation terminal or tablet with large buttons, seeing only “the task I’m currently handling”—three buttons: start, pause, finish. No tables appear on the screen.
- Team leaders: Use a smartphone or workshop dashboard to monitor the status of all workstations in their shift, identifying bottlenecks in just two minutes.
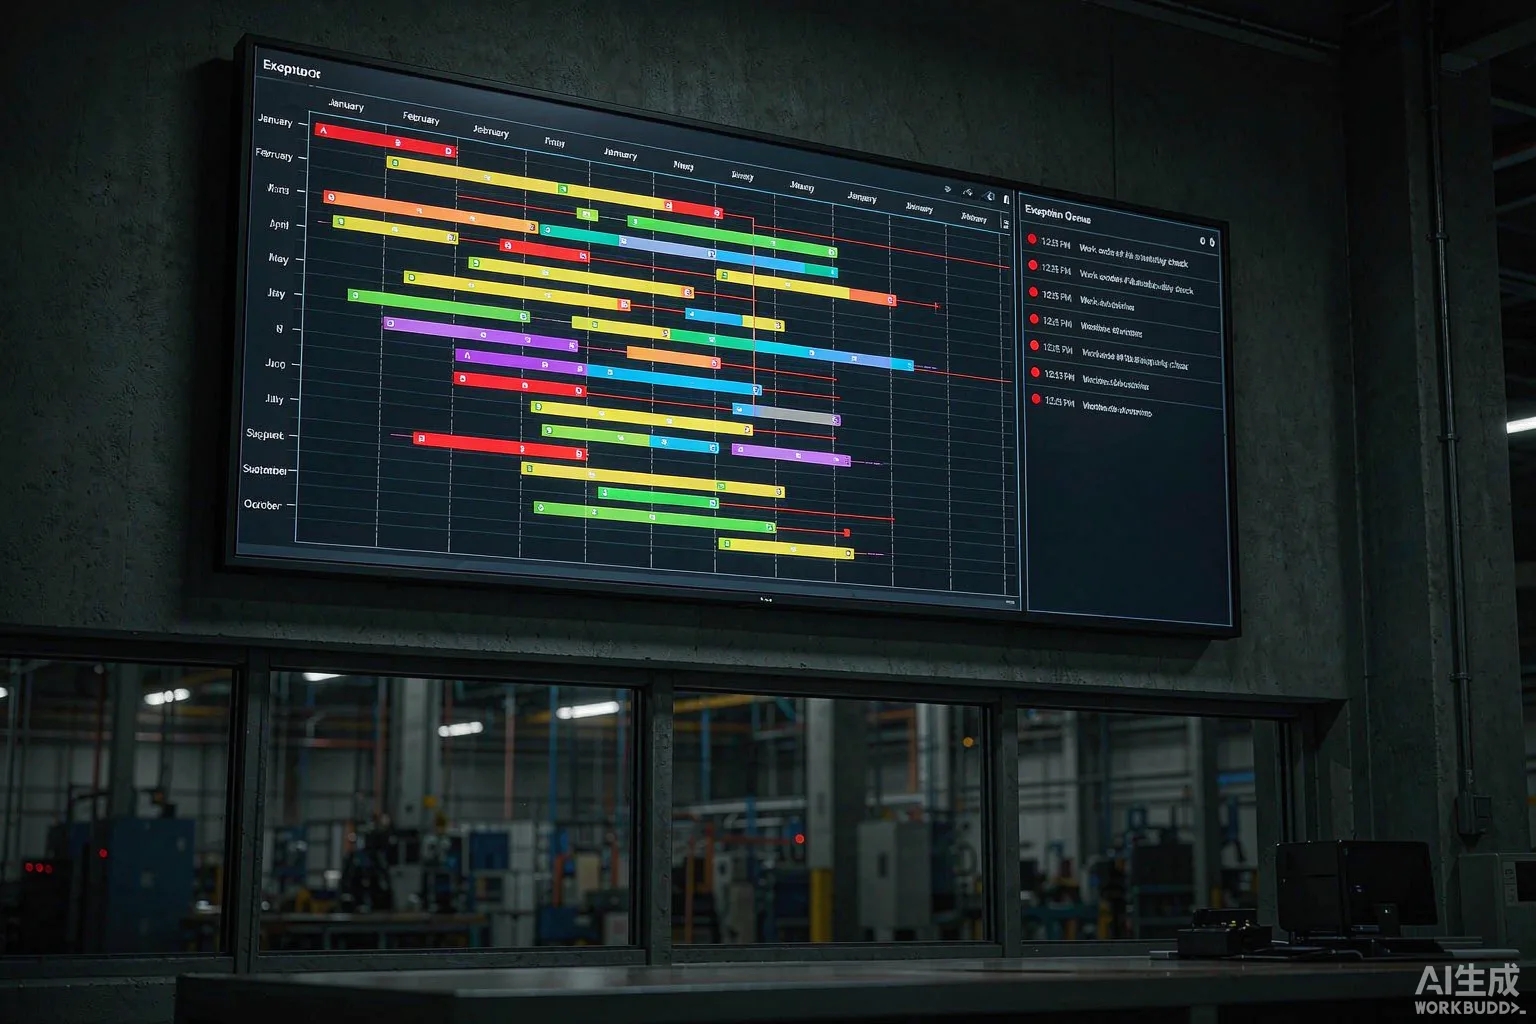
- Dispatchers or planners: Use a PC to view the Gantt chart and exception list for all workstations across the factory, focusing on scheduling adjustments and responding to anomalies.
- Quality or process specialists: Have a separate entry point, reviewing first‑inspection pass rates, rework ratios, and SPC trend charts;they do not directly modify work order statuses, only issuing “line stop” or “release” decisions.
Data model
Four core tables, plus a few auxiliary ones, are sufficient:
- work_order: The main work order table, linking sales orders, planning documents, and products.
- work_order_route: Process routing, specifying how many steps each operation requires.
- route_event: The process event stream (the core running log)—who, when, on which machine, and how far along.
- exception_log: Exception logs (material shortages, equipment failures, quality rework).
Status fields (status、current_step、progress_pct) are all calculated in real time from route_event, never stored; only events are saved. This ensures that no matter who modifies a work order, the status always follows the event stream.
Interface boundaries
Clearly delineate the boundaries among the three types of terminals:
- Workstation terminals: Scan → retrieve work order → display process → large buttons for start/pause/finish;no numeric fields are allowed, with all numbers automatically written by PLCs or barcode scanners.
- Team leader dashboards: Grid‑like views of all workstations in the shift, showing green for normal, yellow for over‑schedule, and red for abnormalities. Clicking red takes you straight to the detailed exception log.
- Dispatcher PC: Gantt charts should include resource load and exception queues; exceptions must be segregated into separate queues, and cannot be mixed into the Gantt chart, making it difficult for users to “find the exceptions.”
03 How to develop: three barriers—data collection, interfaces, and acceptance
The core challenge during the development phase is “making the shop floor willing to use it.” For the shop floor to be willing to use it, the solution must be “just one click,” not “fill in a bunch of fields.” Behind this lies the concept of three barriers.
Data collection barrier
Data collection is divided into three layers:
- Direct device data acquisition: CNC machines, injection molding machines, and SMT equipment connect via OPC UA or Modbus, writing start/stop signals, current program numbers, and real-time counts directly into the event stream. This part is the most challenging but also the most valuable; once completed, it eliminates reliance on manual input.
- Scanning plus buttons: At manual workstations, operators use a barcode scanner (for materials) combined with large buttons (start/pause/completion). The barcode scanner operates via USB HID, outputting plain text strings; no OCR, no image recognition, as even a single network packet can render images useless on the shop floor.
- Weighing/counting/optical barrier: Material weighing, part counting, and safety light curtains all use PLC signals converted to OPC.
The three floors share a single data acquisition gateway service; the gateway normalizes different protocols into a unified event format (JSON), which is written to a message queue (Kafka or RabbitMQ). Subscribing services then consume these events and write them to the database. This way, when equipment or workstations are changed, only the gateway needs updating—without rewriting the main business system.
Interface gate
External interfaces fall into two categories:
- Upstream: ERP or MES issues work orders, sales orders, and BOMs. This serves as the primary data source, and our system only reads—not writes—to avoid dual systems modifying work order statuses.
- Downstream: The financial system requires labor hours and costs; the customer system needs delivery progress; and the supplier system needs to track kit assembly status. Downstream systems trigger “event-driven” or “scheduled pull” processes, but they are not allowed to overwrite work order statuses in our system.
Interface design principle:Event streams flow outward only—no inbound traffic. Our system acts as the source of truth, while external systems serve as subscribers. By adhering to this rule, we ensure there is always only one version of the truth regarding progress.
Acceptance gate
Acceptance does not mean “functionality works”; rather, it involves three key aspects:
- Data authenticity: Randomly select five work orders, compare them against whiteboards or on-site video recordings, and verify that the system’s recorded start and finish times differ from actual times by no more than five minutes.
- Exception closed-loop: Create a material shortage exception and verify that from the team leader’s creation, through dispatcher handling, procurement replenishment, to workstation restoration, every step leaves a trace—and that the entire process can be tracked within the exception queue within five minutes.
- Cycle time comparison: For one consecutive week, record each workstation’s actual cycle time and compare it with the standard process quota; if the discrepancy exceeds 30%, an automatic warning notice is generated.
Only after passing all three of these tests can we say, “We truly have visibility into process progress.”
Conclusion: Implementation sequence, risks, and metrics
Projects of this kind should be rolled out in three phases—avoid going live all at once:
- Phase I (1–2 months): First deploy the workstation terminal with overtime supervisor dashboards, covering just one production line. The goal is for “80% of sticky notes on the whiteboard to automatically sync into the system.”
- Phase II (2–3 months): Add dispatcher PCs, exception queues, and direct equipment integration, expanding coverage to all major production lines across the plant. The aim is to eliminate the need for on-site phone calls asking about progress.
- Phase III (as needed): Connect with ERP, finance, and customer systems to perform cycle-time optimization and SPC analysis. This phase is optional; decisions will be made based on on-site feedback after completing the first two phases.
Common risks:
- On-site resistance: Fear of being monitored or compared. Solution: Display only workstations on the interface—no personal information; set metrics at the team level only, without individual rankings.
- Data collection omissions: Older equipment lacks communication ports, requiring barcode scanners as substitutes. Acceptance testing must confirm that omission rates do not exceed 5%.
- Labor-hour distortion: Operators repeatedly start and stop work to “pad numbers.” If the system detects multiple starts within five minutes at the same workstation, such activity is immediately flagged as an anomaly.
There are only three indicators determining whether the inspection project succeeds:
- Dispatcher call volume: After launch, it drops by more than 50%.
- Average response time for exceptions: Reduced from hours to minutes.
- Customer-accessible progress: Complaint rates related to delivery delays decline by over 30%.
Once these three metrics are achieved on-site, the whiteboards on the walls can finally be cleared, signifying that progress has truly been accomplished.